Purchases of new homes plunged 13.4% in July to only 394,000, the steepest drop in years underscoring the uneven pace of recovery. Worse, April, May and June new home sales were revised sharply lower and are officially in the books at just 446,000, 439,000 and 445,000 respectively. Moreover, the sales rate is only 6.8% higher year-over-year, hardly breakneck improvement. This explains why residential construction employment growth has barely increased.
Tag Archives: elliot eisenberg and graphsandlaughs
Tax Unreform
Between Benghazi, the heavy-handed AP data grab and the IRS fiasco, any tiny window for tax reform has all but shut. While Senator Baucus and Representative Camp, who head up both tax writing committees have 17 months until the next election, the combination of an uninvolved administration, 2014 being an election year, fierce lobbying against change by corporations, and a requirement for budget neutrality make any chance for reform history.
Excellent Equities Environment
The current bull market that began on 3/9/09 has lifted the S&P 500 over 146%, and now ranks as the fifth best bull market in history. It’s also within 10% of the fourth best rally of 157.70% that occurred between 4/28/42 and 5/29/46. The combination of steady growth, no inflation, low interest rates and no wage pressure is a golden environment for equities. I think I’ll buy more Enron!
More Mediocrity
The good: the index of leading economic indicators rose, as did retail sales, consumer sentiment, and housing permits. The bad: Europe is now officially in recession, first-time unemployment claims rose, manufacturing activity declined, inflation as measured four different ways is non-existent, housing starts weakened, and industrial production and capacity utilization both fell more than expected. Data like this is why talk of tapering QE3 before January 2014 is exceptionally unlikely.
Of Interest
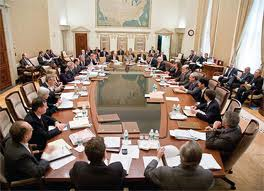
The interest rate setting Federal Reserve Open Market Committee always includes the seven Governors of the Federal Reserve System and the President of the Federal Reserve Bank (FRB) NY. The remaining four members rotate among the Presidents of the other 11 FRBs. For policy purposes, the rotating members don’t matter. Moreover, Governors Fisher, Lacker and Plosser all of whom are calling for an end to QE3, aren’t currently voting members.
Scared Debtless
In Q1 2013, total household indebtedness fell to $11.23 trillion, 1% lower than in Q4 2012 and way down from the peak of $12.68 trillion in Q3 2008. Mortgage debt now stands at $7.93 trillion, HELOCs are at $522 billion, student loans are at $986 billion (yikes) and auto, credit card and consumer loans total $1.8 trillion. While less debt is good in the long-run, deleveraging is delaying the recovery.
Economic Models
The Friday File: Female models like Heidi Klum and Bar Rafaeli make millions annually, yet there isn’t even one famous male model. I think this is this because women spend much more on fashion and cosmetics than men. Moreover, they get their purchase ideas from fashion magazines which are full of beautiful women. Thus, the only way to stand out in this abnormally attractive field is to hire a bombshell.
House Work
Part of the reason employment growth is so weak is that despite sizable increases in residential construction spending, increases in construction employment have been MIA. From April 2012 to April 2013, residential construction put-in-place increased from $249 billion to $295 billion, an 18% rise. However, during the same period, the number of residential building employees and residential specialty trade contractors rose from 2,048,100 to 2,131,800 or by just 4%!
Where’s Daddy?
In 2011, 4.1 million women gave birth, 36% of which were unmarried, up from 31% in 2005. 57% of women without a high-school degree, 49% of women with a high-school diploma, 40% of women with some college and 8.8% of women with a bachelor’s who gave birth were unmarried. States with the highest percentages of births to unwed women include DC at 51%, LA at 49% and MS/NM at 48%.
Economic Gamble
In a hopeful sign for the economy, gross gaming revenues rose 4.8% in 2012 to $37.34 billion, and are now (not accounting for inflation or Native American casinos) just $180 million below the all-time high of $37.52 billion set in 2007. NV led the pack with $10.70 billion spent, NJ was next at $3.32 billion, followed by PA at $3.02, IN at $2.72, LA at $2.37 and MS at $2.24.


